

In recent years, there has been a significant advancement in the field of Artificial Intelligence (AI) and Augmented Reality (AR). These technologies have become increasingly popular and have the potential to enhance virtual experiences in various fields such as gaming, education, healthcare, and...
How Energy Analysis Software Helps Factories Cut Operating Costs
46
13.10.2026
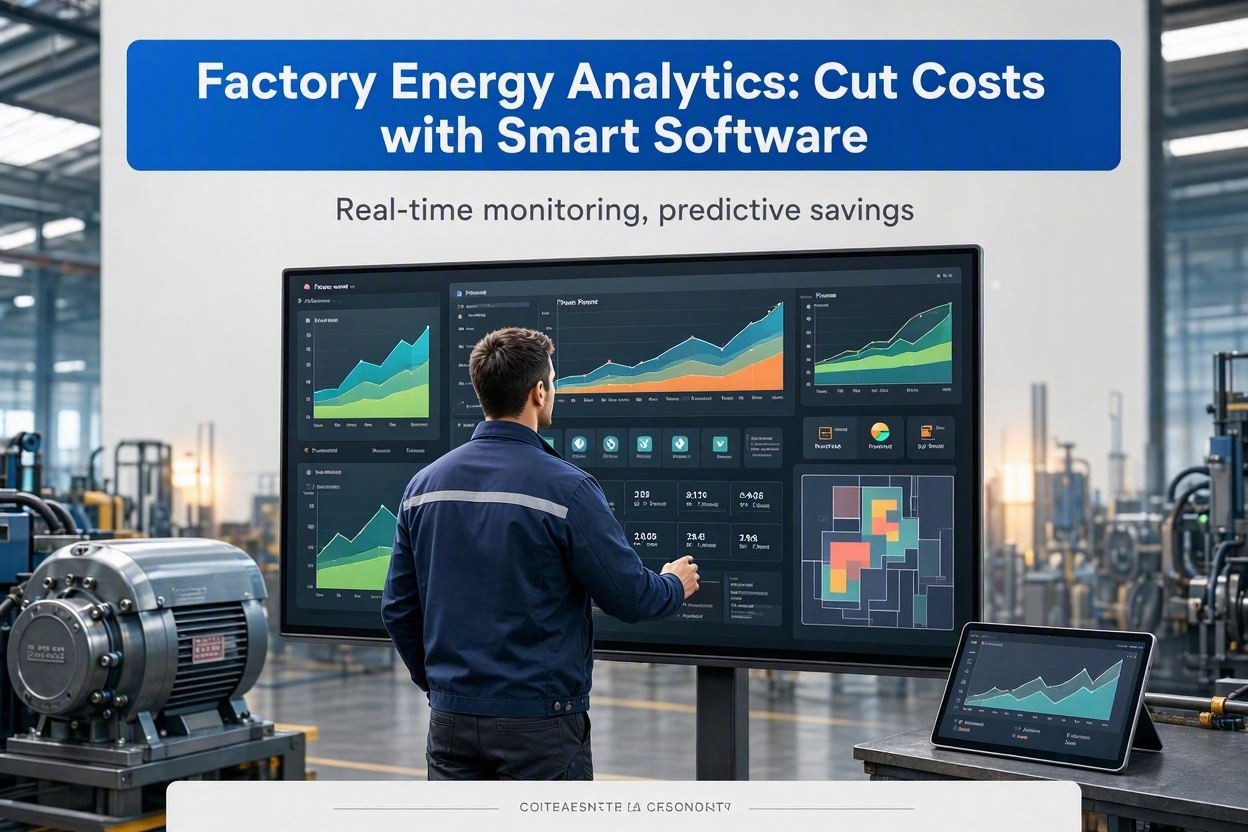
Energy is often one of the largest controllable expenses in a factory. Motors, compressors, chillers, ovens, pumps, lighting, and HVAC systems may run for thousands of hours each year, sometimes at the wrong time or under inefficient conditions. A modern energy analysis program turns this complex consumption pattern into clear operational insight. By collecting data, detecting waste, and recommending targeted actions, it helps manufacturers reduce costs without compromising production quality.
What the Program Actually Analyzes
A factory energy analytics platform does more than display utility bills. It connects to meters, sensors, production systems, and building management equipment to understand how, when, and why energy is being used. The software compares real-time consumption with production schedules, equipment status, weather conditions, tariff periods, and historical baselines.
Key Data Sources
The quality of recommendations depends on the quality of data. Most successful implementations combine several inputs:
- Electricity, gas, steam, compressed air, and water meter readings
- Machine-level energy consumption from smart meters or controllers
- Production output, batch records, and shift schedules
- Utility tariffs, peak demand charges, and time-of-use pricing
- Temperature, humidity, and other environmental conditions
When these data streams are combined, the program can calculate energy intensity, such as kilowatt-hours per unit produced, rather than only total consumption. This distinction is essential because a busy factory may use more energy overall while still becoming more efficient per product.
How the Software Finds Waste
Energy waste in factories is rarely caused by one obvious problem. It is usually the result of small inefficiencies repeated every day. Analytics software identifies these patterns faster than manual reviews because it continuously monitors operations and flags abnormal behavior.
Common Inefficiencies Detected
The program may discover that compressed air systems leak during non-production hours, idle conveyors run through breaks, or chillers operate at full load when partial load would be enough. It can also identify demand spikes caused by starting several large machines at the same time. In facilities with complex tariffs, avoiding these peaks can reduce costs significantly.
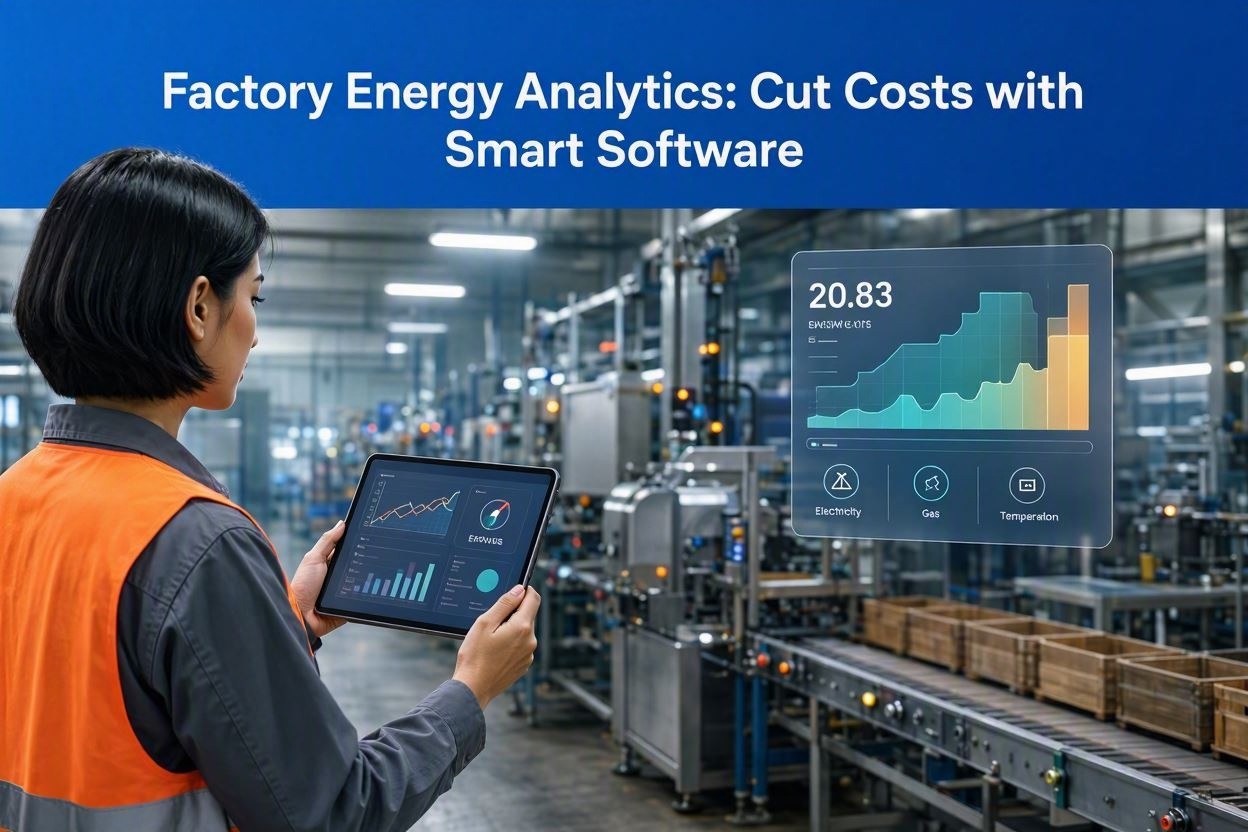
Advanced tools use machine learning to build a normal performance profile for each major energy user. If a motor begins drawing more power than expected for the same workload, the system can warn maintenance teams before the issue becomes a breakdown. This makes energy analytics useful not only for cost control but also for reliability and predictive maintenance.
Recommendations That Lead to Real Savings
The best programs do not simply report problems; they rank opportunities by financial impact, ease of implementation, and expected payback period. This helps managers decide whether to begin with no-cost operational changes or plan capital investments.
Typical Cost-Cutting Actions
- Shift energy-intensive processes away from peak tariff periods.
- Sequence equipment start-ups to reduce maximum demand charges.
- Repair compressed air leaks and optimize system pressure.
- Adjust HVAC and ventilation schedules to match occupancy and production.
- Replace inefficient motors, drives, lighting, or heat recovery equipment.
- Set automatic alerts for abnormal consumption during weekends or shutdowns.
Many factories achieve their first savings through operational discipline: turning equipment off when it is not needed, improving scheduling, and correcting control settings. Larger projects, such as variable frequency drives or waste heat recovery, can then be justified with accurate savings estimates based on measured data.
Why Integration Matters
For energy analytics to influence daily decisions, it must fit into existing workflows. Dashboards should be understandable to plant managers, engineers, maintenance teams, and financial controllers. Reports should translate technical energy data into business metrics, including cost per line, cost per shift, and cost per unit.
From Insight to Accountability
A useful program assigns responsibility. If Line 3 uses more energy than similar lines, the relevant supervisor can investigate. If weekend consumption remains high, facilities staff can check shutdown procedures. If a recommended action is completed, the software should verify savings against a baseline, preventing guesswork and keeping teams focused on measurable results.
Choosing the Right Energy Analysis Program
Factories should look for software that supports detailed metering, flexible reporting, tariff modeling, anomaly detection, and integration with production data. Scalability is also important: a pilot on one line should be able to expand across the whole plant or multiple sites. Security, data ownership, and vendor support should be reviewed before implementation.
The return on investment depends on the facility, but the strongest results come when analytics are paired with management commitment. A program can reveal waste and suggest cost-saving actions, but people must approve changes, maintain equipment, and monitor performance. When software insight and operational discipline work together, factory energy consumption becomes a controllable source of competitive advantage.